Vacuum leaks have led more than one technician deep down the rabbit hole, wasting hours upon hours, pressurizing the system with nitrogen—or nitrogen and a trace gas—leak testing with electronic leak detectors, and soap bubbles, removing panels to check evaporators, condensers, and other components that are buried in places that are not easy to get to nor fun to go. Hours have been spent watching a rock steady standing pressure test, leaving the technician to dream about a magical particle that is blocking some torturous leak while under pressure, and then when under a vacuum air rushes in, never letting the system reach or hold an acceptable level of vacuum. Even worse, are when those leaks win and the technician hastily dumps the refrigerant charge into an improperly evacuated system. A guarantee that someone will return for a much more time consuming and costly repair in the near future.
The evacuation can stall or rise during a decay test as refrigerant outgasses, moisture boils off, components outgas, or trapped gasses are released from o-rings, threads or flange gaskets. This outgassing can mimic an apparent or “virtual” leak in the system, something no one wants to see.
With typical vacuum gauges, there is no way to definitively tell the difference between a real and virtual leak, and there is a very good reason why. Most vacuum gauges, whether analog or digital are logarithmic scaled, meaning they have many different scales or characteristics as they move through different stages of evacuation. Even those that advertise full range single micron resolution are subject to varying accuracy, making them non-linear in nature as they approach their ideal range of measure. What this means is on a graph or LED display, the manufacturer is trying to display a huge range approaching 1,000,000 microns (760K to be exact) on a very small digital or analog display. This squishes all that information in a very small area, changing how it is displayed and hiding some very significant information about what is really happening during the evacuation and decay process.
Decay testing has been used for as long as I can remember to “try” and identify leaks in a vacuum. For me, this process has proven fruitless, frustrating, and more confused than anything because of the science as taught simply never works. In textbooks, a real leak and a virtual leak have very different characteristics making them easy to visually identify while in field practice, it is like trying to identify shades of gray in the dark, you simply cannot tell the difference.
Let There Be Light!
Doing projects like application development with the BluVac+ Professional leads to a lot of testing, and for me, testing means attempting to make the science work. The difference between a real leak and a virtual leak (degassing) should be very apparent and, lo-and-behold, it is if you look at it in the right light. Not only is it apparent, but it is likely the most useful feature of a vacuum gauge aside from total pressure indication (vacuum level) that I have ever found.
Looking at a vacuum in the right light was a simple yet so complex that it was not possible until we attached a smartphone to a vacuum gauge. Unrestricted in user interface design by lights or an analog display, we could for the first time change the way the information was viewed for different elements of the evacuation process. Far from complex, it was as simple as going from logarithmic to a linear display during the decay test.


Now for you engineers and mathematicians in the group, I don’t expect this to be an epiphany, but for those of us that don’t use logarithmic scales every day or at least me, it certainly was an ah-ha moment. What I had been looking for was hidden, and masked. Not only was this hidden in our design, but literally that of every vacuum gauge that I have ever used. One small change in how the data was displayed revealed what had been hidden from me for over 30 years, the difference between a real and virtual leak in a system. Because of the logarithmic scale, the decay always visually indicated tendencies of a tightly sealed (but dirty or wet) system that simply needed further evaluation. The tell tail signs of a leak were mathematically hidden from view. Solving one problem, (showing a million of points of information on a single interface) had led to another which was losing characteristics that were critical to solving the actual vs apparent leak problem.
For a service technician, this is a HUGE step forward in evacuation technology because the difference between a virtual leak and a real one are now easily distinguishable in seconds by the means of the app. This means now you know if you simply need more time on the pump, or your system is actually leaking, making a pressure test and a leak test truly necessary. For technicians, this means potentially hundreds of hours saved annually during the installation and service process.
Telling the Difference Between a Leak and “Virtual” Leak
As a system is evacuated, many times the process will stall. The stall happens due to moisture as dehydration is occurring, stalling or slowing the evacuation until the moisture is removed. The question for the technician becomes “is the system simply stalled due to moisture or outgassing, or is there a leak in the system that the pump cannot overcome?”
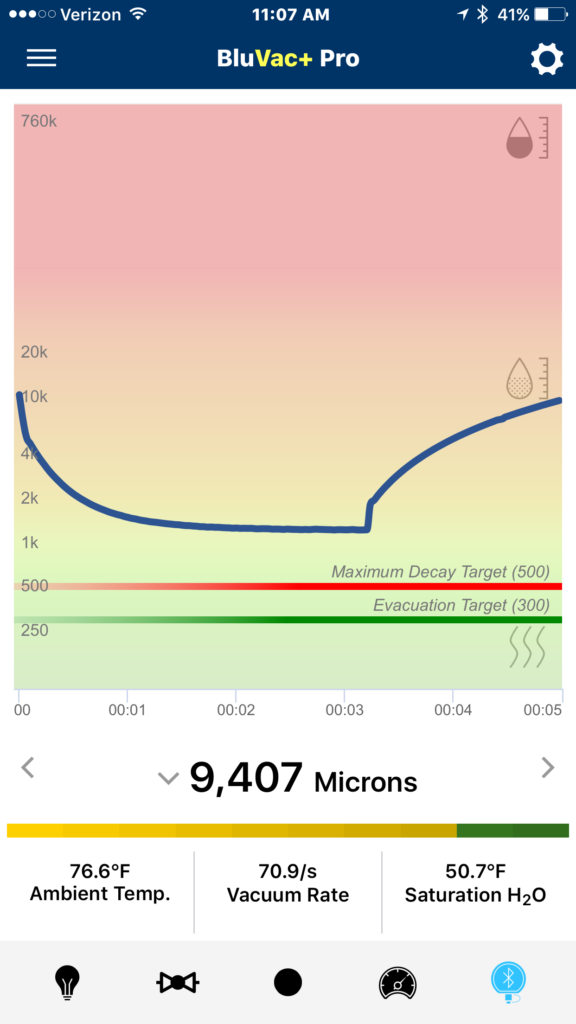
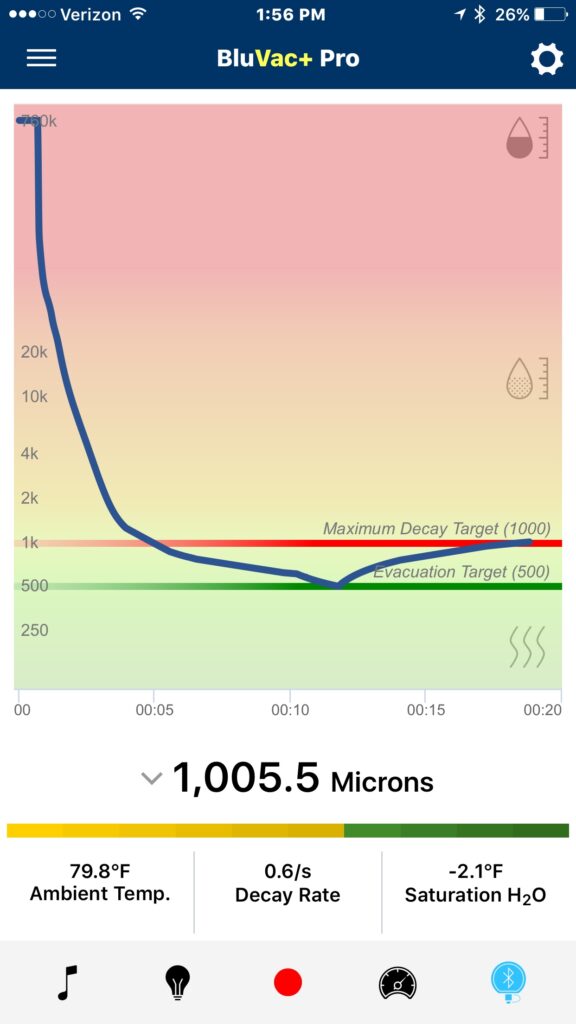
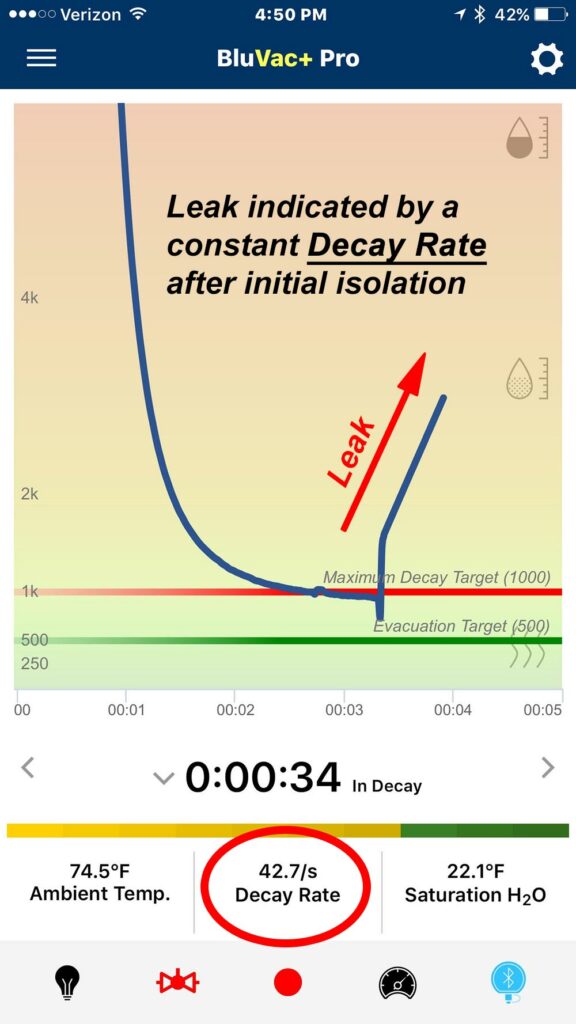
Now as you will see, on a linear graph this is as black and white as it could ever be. For system (A) below, when the vacuum rig was isolated, you will notice a rapid rise, then a continued rise at a steady rate. This can easily be explained by the fact that with a leak, the air infiltration will happen at a reasonably steady rate provided the system is reasonably below atmospheric pressure. Remember even at 10,000 microns, 99% of the atmosphere has been removed and we are well into a vacuum. Even at these higher levels, a leak can easily be detected.
System (B) shows the characteristics of a virtual leak. There is still a rapid rise at isolation, but now the rise starts to tail off and eventually will rise no more. This characteristic becomes more pronounced at lower vacuum levels when larger hoses are used as considerably more vapors evolve until the system becomes “clean” and degassed. A clean tight system will flatline at isolation because it is clean, dry and tight giving you a good indication of the overall system cleanliness and condition.
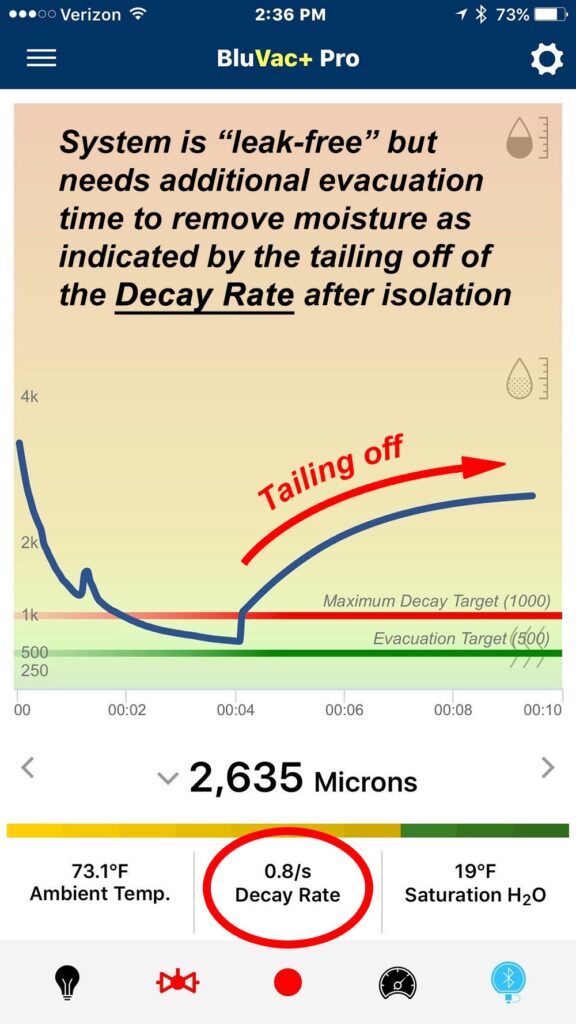
This feature of the BluVac+ Professional can easily be accessed at any time by simply isolating the core tools, and tapping the isolate button on the application. The graph will rescale, and in about 30 seconds you will have a definitive answer about what is happening in your system. Leak detection in a vacuum has never been easier. Another great reason to have the BluVac+ Professional in your toolbox.

This is a fantastic article. I do have a few questions for the writer:
I was watching my BluVac quite closely today as it was my first major repair using this tool, a compressor replacement that had a mechanical seizure on a 2 ton 410a residential heat pump. The compressor was not burned and the oil remained uncompromised. The biflow liquid line drier was replaced during the repair.
I placed the gauge on my core removal tools and used Appion’s TEZ8 with 1/2″ hoses to perform the evacuation. After roughly two hours of evacuation with four nitrogen breaks, I finally got my finishing vacuum down to 311 microns. However, every single time I performed an isolation test my decay rose steadily up to 1300 microns, beginning at a rate of 1.1 micron rise per second and eventually slowing and leveling off. After the second isolation test, I began to fear that there was a leak in my vacuum setup and replaced fittings and hoses in an attempt to source my leak.
These symptoms were consistent with the description above of System (B). It is described above “as refrigerant outgasses, moisture boils off, components outgas, or trapped gasses are released from o-rings, threads or flange gaskets.” How long should this process reasonably take place? Will it always take place regardless of the finishing vacuum? I’m fairly certain my finishing vacuum saw the system thoroughly dry and safe to operate, so I restored the system after numerous attempts to hold my decay below 1000 microns. Was my belief justified or should I be concerned about the state of the system?
Zach,
There are a few things that come to mind. First, what was your ultimate pull down of your pump? Did you connect the gauge directly to the pump and see the ultimate vacuum that it could achieve. The pump should pull under 50 microns very quickly. I have seen many pumps including the TEZ 8 needing service or simply an oil change that was at 100 microns or over and this will significantly increase the evacuation times. Sometimes with a TEZ 8, it is as simple as the debris catch tube or gasket.
Pending those items. R410a is very miscible with oil and can take a long time to completely remove from an accumulator and lines. Refrigerant will affect the readings of all micron gauges at the higher vacuum levels. To see this simply expose the sensor to a little refrigerant gas. The nitrogen sweeps help a lot with this, and speed up the evacuation. Additionally POE oil can hold a ton of moisture. The fact that the compressor seized make me wonder if you did not have a compressor motor failure due to copper plating or rusting of the bearings due to moisture. You might want to cut it open and see what the cause was. You might have been removing moisture, and from POE oil, that takes a very long time with a vacuum pump, and can only be completely achieved with the filter dryer. It is always a good practice to change the accumulator at the same time as it can be holding a lot of potentially wet oil, and or rust if the system was not installed/evacuated correctly at the time of installation, again this would add time to the evacuation.
In this situation, I would have installed a moisture indicator (sight glass with moisture eye) to determine after the change out to assure the moisture was completely removed during service. With POE oil, multiple dryer changes may be only was to clean it up.
Finally, most times during service, a finishing vacuum isolated and held under 1000 microns for 10 minutes is more than adequate assuming that there has been a dryer change. Let the dryer do the work, and pump the system down and change it again if needed. Always cut the dryer out so you do not drive the moisture back out with heat. Once POE oil is wet, you have to get the moisture our with the dryer. It is the only way. A dryer can take the dew point as low as -61, where evacuation may only get you in the -20s. Obviously, for a new installation, you would want to get the finishing vacuum below 500 microns.
Hope this helps.
Jim
Thanks for the quick reply, Jim.
I just performed an ultimate pulldown test a couple of days ago and achieved 50 microns in a matter of seconds. During evacuation, sometimes the debris catch tube will fill with oil from the system which I’m religious about cleaning out using denatured alcohol. Pump had a fresh oil change before the start of the new vacuum and I changed it once more after my nitrogen sweeps.
Thankfully, this system did not have an accumulator which would have slowed my evacuation down even more.
After reading the rest of your articles and listening closely to your reply, I’ve determined that I’ll return to the job to replace the dryer and install a sight glass to observe the moisture. Your research and dedication to the trade has helped me tremendously. Thank you again.
Jim
This is an amazing article!
Thank you for sharing!
I have a funny story.
I changed a couple trane 100 ton E compressors on an old chiller last week.
Micron gauge on the liquid line close to the TEV.
1/2″ hoses to a vacuum tree on the suction side of the compressor and on the condenser barrel.
Got it to 525 microns.
Valve it off.
30 minutes it came up to 585 microns.
I started to weigh in the charge and heard a small noise.
I had a leak on a 1/4″ copper line I brazed.
How frustrating! !!
Frank,
I have had that happen myself, more than once.
Jim
Jim
Your Training is shared via Drop Box with our Field Staff, as your insight is greatly appreciated and shared to “qualify” what we teach. As far as a POE or for that matter any other oil entrained in smaller systems, we highly recommend a system flush. However, I believe that the Compressor OEM’s should have a way to remove POE oil from Hermetic Systems that would greatly enhance our methods of evacuation. It is virtually impossible as you have stated previously that moisture entrained in POE can not be removed effectively without agitating that oil in the sump, let alone that oil that may be in other system components, just laying there and laughing at us!
Joe,
Great to hear that. As far as an easy oil change, I agree, but I can not say enough about the importance of multiple dryer changes and using a moisture indicator. With a good flare tool, I would not hesitate to use flare dryers either.
Jim